
IBM Data Science Experience (DSX)

How do data practitioners take complex data sets and distill them into meaningful outcomes?
Role: team lead of 6 designers in a 250-person team across 8 time zones
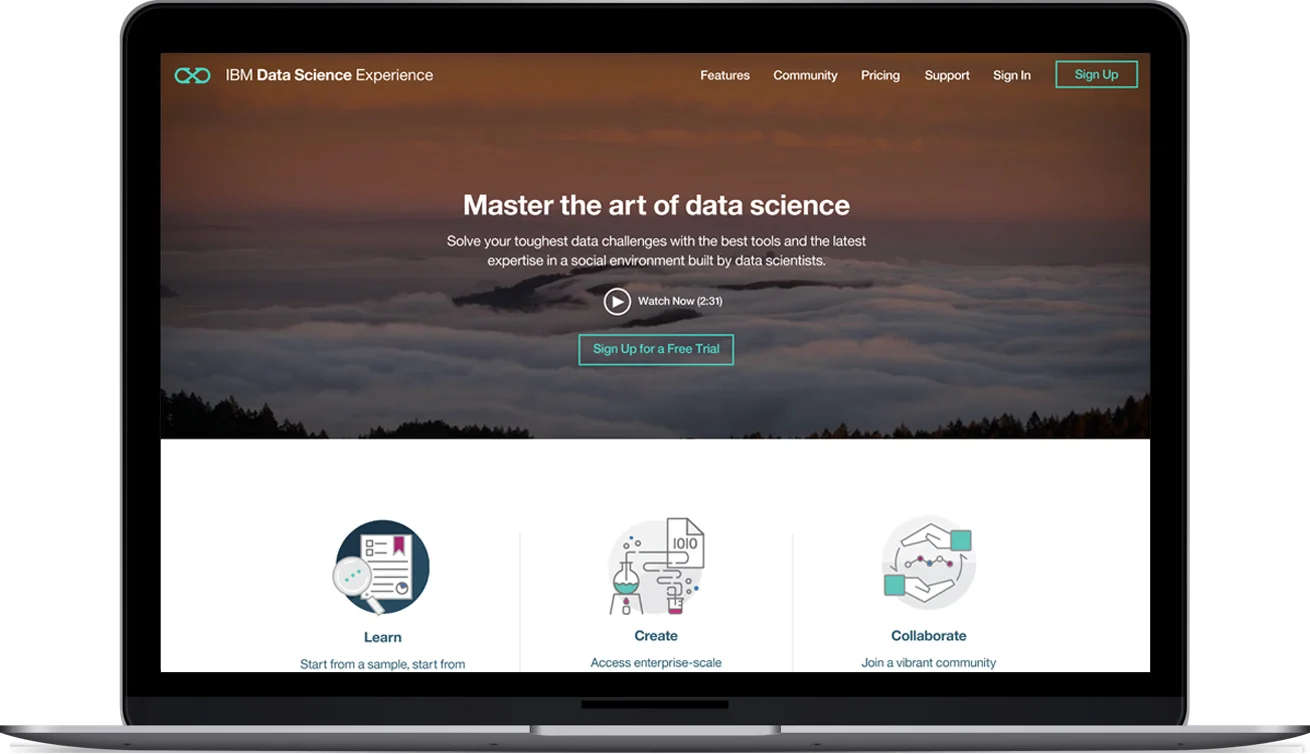
What: from product strategy to final design - datascience.ibm.com. Sign-Up conversion rate: 6% monthly
When: April 2016 - November 2016
The product
In early 2016, there wasn't a unified platform available to data practitioners. In response to this need, we gave birth to Data Science Experience (DSX), an environment that has everything a data scientist needs to be successful. DSX is an interactive, collaborative, cloud-based environment where data scientists can use powerful tools to activate their insights.
True Innovation
DSX merges powerful set of tools with an online community for data scientists. There are no barriers between the creative and the learning experience, which we found is exactly how data scientists work.
Design-led journey
Creating DSX was a major effort involving a team of 250+ people across 8 timezones. As the design team, we led the effort, from the concept to the strategy, research, storyboarding, information architecture, low-fidelity to high-fidelity designs, and user feedback. We pushed back against a historically development-led organization to ensure that our users' experience was not to be compromised.

IBM Watson Data Platform: a comprehensive platform designed for the cloud. Every persona has a dedicated environment and all of them are connected through data.
Strong Research Foundation
We started our journey by understanding our users, and we defined our vision (Watson Data Platform) based on their needs. We immersed ourselves in the field through interviews, conferences, and contextual inquiries with every data practitioner we could find. We outlined four distinct personas among data practitioners, with unique interests and areas of focus. All of their work is deeply interconnected by data, so we created IBM Watson Data Platform to bridge their needs. We decided to focus first on the needs of data scientists, we studied their workflow and we transformed their pain-points into design opportunities.
Design decisions
We wanted to create an interface that is open and dynamic, just like the modeling process we observed. We determined that our concept must allow data scientists to converse, learn, and research in the context of their software. We knew our design had to operate as a toolbox that was more dynamic than just a collection of software applications.
Foundation: scalable architecture
Project page and 'add data flow' tab opened on the right in the maker palette
- Flexible and scalable: DSX is a platform made out of a series of legacy and open source products. In order to allow different tools to coexist, we designed a flexible and scalable architecture. We provided a repeatable framework - common UI, information hierarchy, customizable components - to support multiple products to come.
Notebook page, with the 'chat' tab open to allow collaboration between team members
- Consistent experience and common UI: A key goal of our design organization is to maintain consistency across our expansive portfolio. We used our design style-guide for DSX, and we proposed extensions to it when needed. The user experience working through DSX is seamless, and every new component that is subsequently added follows the same style-guide. Following the success of DSX on the cloud, we worked to put DSX on-premises behind organizations' firewalls, where they can experience the power of DSX in the familiarity of their own environments. Again, the user experience is consistent with what we defined for the cloud.
- Projects: analytics assets and bookmarks are bundled together, ready to be share with collaborators and on social media.Each project has an 'Overview' page where the user reviews the work at a glance, and a dedicated page per each component, in which they can do productive work. The challenge was to accommodate needs coming from the tools included in the platform, so we asked each product team to provide requirements and priorities, and we displayed the main info in the project page through the use of scalable tables.

Action bar in Project Page
Community page, to learn and share your work with an active community
- Action bar: it presents some common actions shared across products - explore, add data, chat, history and info - and a product-specific customizable area. The design of the action bar had some resistance from development due to the time needed to code it, but user testing and competitive analysis (Google Drive and Box Enterprise have a similar approach) proved the value of it.
Add data asset to a project
- Maker palette: the right side panel developed from the idea that the community is a tool — just as important as a notebook or data set. It appears in a panel that can be opened and closed at will. A key feature of our maker palette is the ability to display mixed content within a singular environment. A data scientist can search for any type of asset within their workspace, and review and reference it in one cohesive environment. The benefit is that it’s not specific to a file format or tool, so it can be accessed from any part of the interface. While working, a data scientist can find data sets, access papers, view tutorials, and compare their code to others'. When they’re uninspired or stuck, the community acts as peer, tool, and teacher.
What I learned

Explorations around 'Community'
1. How to lead a team of designers:
- Designers are passionate creatures: tight our design work with the business goals of our organization has proved to be a strong driver for productivity. Designers need to feel they are making an impact in the overall vision of the business.
- Designers need to be challenged: we had a constant design critique within the project-squad and across the design studios in Austin and Germany.
- Designers need to get recognition of their work: never forget to recognize someone for the work they have done. Always show how every single contribution is making the difference in the overall project.
- Designers need to see they are helping their users: embed research in daily design activities, allow everyone to conduct interviews and user testing, advocate for the value of research in cross-teams meetings.

Features brainstorming
2. How to advocate for design: Work for IBM means you are immersed in an engineering environment, where most of the time engineers have 30+ yrs of company-experience. As design lead my role was to constantly push for a good experience of our products, for design consistency and for new visions, even when this means disruption and more work for the involved teams.
3. How to position a new project within business requirements: Design brings innovation, innovation means disruption. Work in a big corporation requires an understanding of the business goals and ability to see the big picture of the organization and its key-drivers. The design studio in San Francisco has proved in more than one occasion that Design is able to translate Business into Products.
Recognition
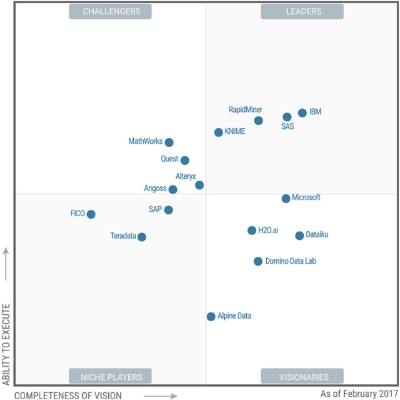
Gartner, "Magic Quadrant for Data Science Platforms", Feb. 2017
Winner of the Red Dot Award: Communication 2017, Interaction and User Experience design
DSX won the Magic Quadrant for Data Science Experience 2017. "Customer base and continued innovation: DSX is likely to be one of the most attractive platforms in the future — modern, open, flexible and suitable for a range of users, from expert data scientists to business people." (Gartner, "Magic Quadrant for Data Science Platforms", Published: 14 February 2017 ID: G00301536)
"Making sense of data can involve a wide variety of tools, and IBM is hoping to make data scientists' lives easier by putting them all in one place. The company released Data Science Experience, a new development environment in the cloud for real-time, high-performance analytics." (PCWorld)
By creating a universal platform [Data Science Experience] IBM hopes to help integrate data trapped in separate protocols residing on incompatible systems. This will not only enable more advanced analytics, it will help us to reimagine how we manage our organizations and compete in the marketplace. (Forbes)
- IBM Data Science Experience is the result of a joint effort of a group of very smart, exciting and inspiring people who I have been lucky enough to work with since I started my journey in IBM. None of the artefacts showed in this page would have been possible without them.-
More Interactions
A data scientist can bookmark any resource from the Community page.
Maker Palette: While working, a data scientist can find data sets, access papers, view tutorials, and compare their code to others'.
Projects are shared among collaborators in few steps.